Fig. 5.
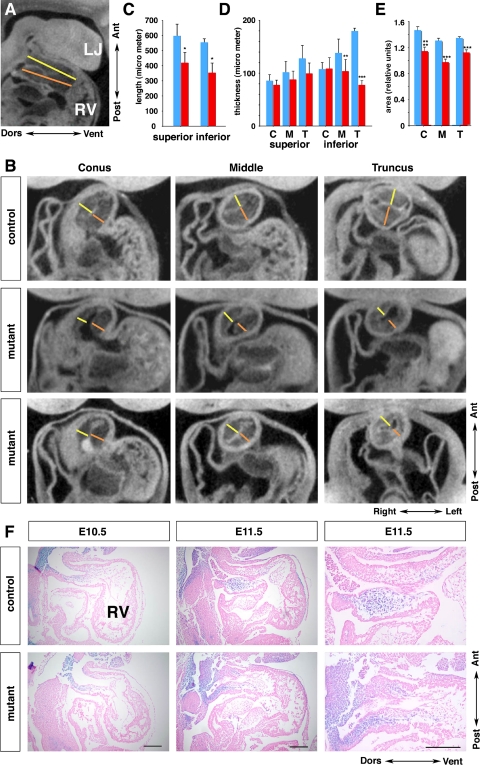
Outflow tract cushions are abnormally short and hypoplastic at E11.5. A and B: reconstructed sagittal and frontal sections by computed topography scan with lines delineating the length (A) and thickness (B) measurements, respectively. Yellow and orange lines indicate the superior and inferior OFT cushion, respectively. C–E: summary of the length (C) and thickness (D) measurements; area measurements of the cushion tissue over these same regions (E). Blue: control; red: mutant; n = 4 for each group. C, conus (closer to RV); M, middle; T, truncus (closer to PhA). *P < 0.02, **P < 0.01, ***P < 0.0001, ****P < 0.0002. F: sagittal sections stained with X-gal showing NCC (blue) in the OFT at E10.5 and E11.5, counterstained with eosin (pink). Right: higher magnifications of middle. Bar = 200 μm. LJ, lower jaw; Ant, anterior, Post, posterior; Dors, dorsal; Vent, ventral.

