Fig. 6.
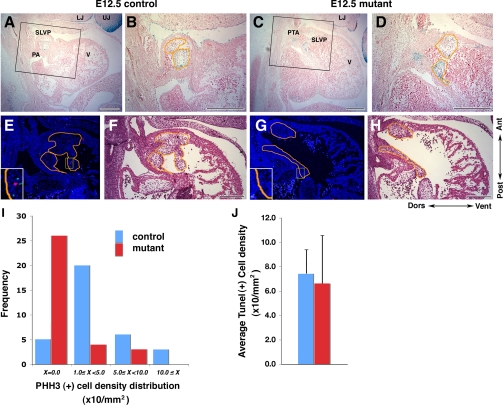
Proliferation in the SLVP at E12.5 is reduced in mutant embryos. A–D: sagittal sections of heart stained with X-gal (blue) to delineate ROSA26 reporter expression in NCC. B and D: higher magnification of the rectangle areas in A and C. E–H: sagittal sections stained with phosphohistone H3 (PHH3; red), terminal deoxynucleotidyl transferase dUTP-mediated nick-end labeling (TUNEL; green), and Topro3 (blue) for nucleus. F and H: same sections as in E and G stained with hematoxylin-eosin after darkfield fluorescence imaging. Orange lined areas indicate SLVP, where signals were counted. E and G, insets: higher magnification images. I: summary of PHH3 density distribution per area of SLVP. Average of PHH3 density in control and mutant was 4.2 and 1.2, respectively (P = 0.001). J: summary of TUNEL-positive cell density in the SLVP. V, ventricle; red, control; blue, mutant. Bar = 200 μm.

