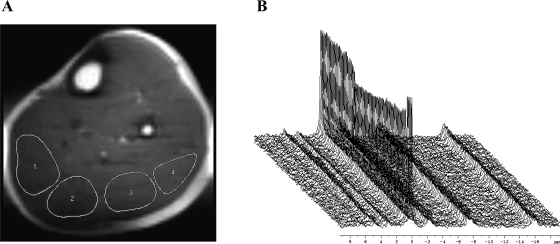
Fig. 1.
A: example 1H image of the lower leg (Ultrafast spin echo imaging, 6 × 6 mm; field of view, 22 × 11 cm; and acquisition matrix, 128 × 36) used for perfusion mapping. Four regions of interest have been highlighted from medial (left side of image) to lateral (right side of image). B: stack plot of 31P spectra (−7 to 20 parts/million) with visible changes in the phosphocreatine (PCr) peak (−1.5–1.5 parts/million) during plantar flexion exercise.

