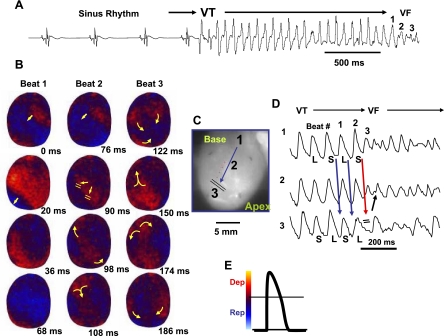
Fig. 2.
Spontaneous initiation of ventricular tachycardia (VT)/VF in an aged rat heart exposed to 0.1 mM H2O2. A: ECG showing the last 5 sinus beats before the sudden onset of VT leading to VF. B: voltage snapshots of the last beat of the VT (beat 1) and of the first 2 beats of the VF (beats 2 and 3). In each snapshot, activation time (in ms) is shown at the bottom right with time 0 (arbitrary) coinciding with the onset of beat 1. The red color in the snapshots represents depolarization (Dep) and the blue repolarization (Rep) as shown in E. The yellow arrows in the snapshots represent the direction of the wavefront propagation with double horizontal lines denoting the site of conduction block. The VT originates from a focal site at the LV base and propagates as single wavefront toward the apex and undergoes functional conduction block at site 3. The two lateral edges of the front, however, continue to propagate laterally (snapshot, 98 ms) forming figure-eight reentry (snapshot, 108 ms). During the second reentrant wavefront, another wavefront emerges from the apical site of the LV (snapshot, 122 ms), disrupting the activation pattern and signaling the onset of VF. D: 3 optical action potentials (APs; labeled 1, 2, and 3) recorded from sites identified on the heart silhouette (C). The 2 downward-pointing blue arrows indicate the direction of propagation from site 1 to site 3 with the red downward-pointing arrow showing block at site 3, followed by retrograde activation (upward-pointing arrow). Notice the emergence of spatially discordant AP duration (APD) alternans preceding conduction block at site 3 when the front with short APD (S) at site 1 encroaches a site (site 3) with long APD (L).

