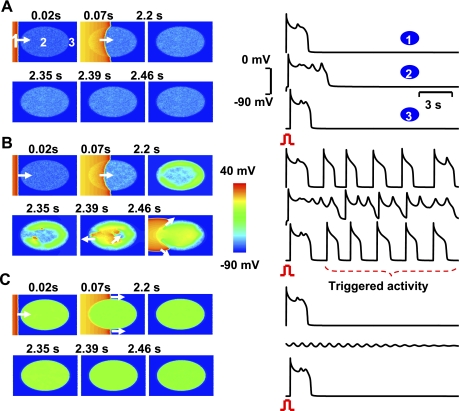
Fig. 9.
Two-dimensional simulations in a tissue with progressive regional increase in the number of fibroblasts to myocyte gap junction couplings. A–C: voltage snapshots after a paced beat from the left border of the tissue (red) with central ellipse (site 2) representing the region of progressive increase in fibroblast to myocyte-coupling ratio (F/M). In A, only small amplitude nonpropagating EADs occur when F/M equals 1. Similar dynamic scenario is also observed when the F/M in the ellipse is raised to 3 as shown in C. After the pace beat, EADs die out locally. However, when the F/M is in the intermediate range (1.1; B), the EADs are now of higher amplitude that propagate and excite the adjacent cardiac tissue as triggered beats. (see supplemental schematic diagram).

