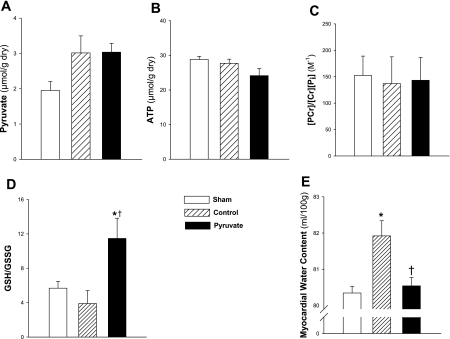
Fig. 2.
Myocardial pyruvate content, energy and antioxidant redox state, and water content. Metabolites and water were measured in left ventricular myocardium sampled 4 h after CPB with control (hatched bars) or pyruvate-fortified (solid bars) cardioplegia, or in nonarrested sham time control (open bars). A and B: pyruvate and ATP contents, respectively. C: phosphocreatine (PCr) phosphorylation potential. D: glutathione (GSH)/glutathione disulfide (GSSG) redox state. E: water content. Cr, creatine; Pi, inorganic phosphate. Values are means ± SE; n = 8 experiments/group. *P < 0.05 vs. sham; †P < 0.05 vs. control.

