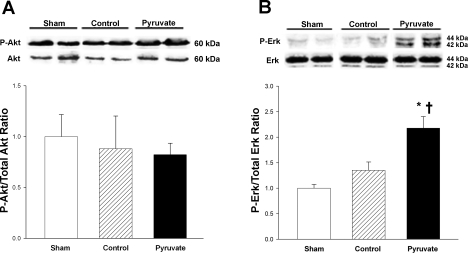
Fig. 7.
Akt and ERK phosphorylation. Top: typical immunoblots of phosphorylated and total Akt (A) and ERK (B). Bottom: ratios of actin-normalized P-Akt/total Akt and P-ERK/total ERK (arbitrary units). Proteins were measured in myocardium sampled 4 h after CPB with control (hatched bars) or pyruvate-fortified (solid bars) cardioplegia, or at the corresponding sham time point (open bars). Values are means ± SE; n = 8 experiments/group. *P < 0.05 vs. sham; †P < 0.05 vs. control.

