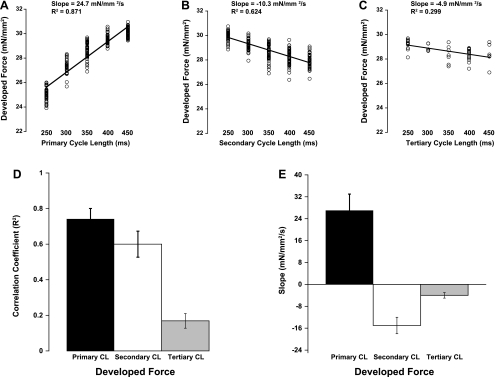
Fig. 4.
A–C show representative plots of the 3 different CLs vs. Fdev. A shows the effect of primary CL (all with a 350-ms secondary CL); B shows the effect of secondary CL (all with a 350-ms primary CL); and C shows the effect of tertiary CL (all with a 350-ms primary and secondary CL). D shows the average correlation coefficient (R2) for all 7 experiments, displaying the tightest relationships between primary and secondary CL. Data are means ± SE. E shows the average slopes of these linear fits to display the positive correlation of Fdev with primary CL and negative correlation for secondary and tertiary CL. All data in D and E are significantly different from zero. All effects of slope were significant (P < 0.05).

