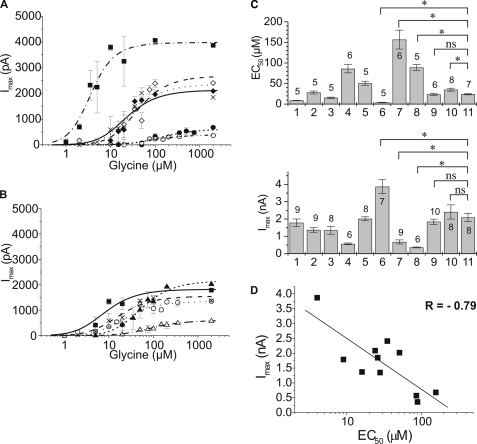
FIGURE 3.
Electrophysiological characterization of GlyR α3 subunit variants. A and B, dose-response analysis of GlyR α3 subunit variants. Current responses to fast glycine application were scaled using the average current response obtained with each subunit (Table 1). The curves through the data points were constructed using a two-ligand model of receptor activation. See Table 1 for constants. A, α3LΔ6 (solid squares, dashed and dotted line), α3L (open diamonds, dashed line), α3K (solid diamonds, dotted line), α3L+6 (crosses, solid line), α3LT358A/Y367F (solid circles, short-dotted line), α3LT358A/S370A (open circles, dashed and double-dotted line). B, α3LY367F (solid squares, solid line), α3LS370A (crosses, dashed line), α3LY367F/S370A (open circles, dotted line), α3LT358A/Y367F/S370A (solid triangles, short-dashed line), and α3LT358A (open triangles, dashed and dotted line). C, summary of receptor expression and functional data of GlyR α3 subunit variants. The subunit and the number of cells used is indicated on top of the bars. The subunits are: 1, α3LY367F; 2, α3LS370A; 3, α3LY367F/S370A; 4, α3LT358A; 5, α3LT358A/Y367F/S370A; 6, α3LΔ6; 7, α3LT358A/Y367F; 8, α3LT358A/S370A; 9, α3L+6; 10, α3L; 11, α3K. Upper panel, EC50 values (means ± S.D.). Differences between wild type (α3L and α3K) and various mutant receptors were tested for significance using one-way analysis of variance; a value of p ≤ 0.05 was considered significant. *, p ≤ 0.05; ns, not significant. Lower panel, Isat values (Table 1); maximum responses of HEK 293 cells transfected with the indicated subunit (means ± S.E.). D, correlation plot of Imax versus EC50 data of the GlyR α3 subunit variants. See Table 1 for constants. The correlation coefficient from a linear fit of the data points was r = −0.79.

