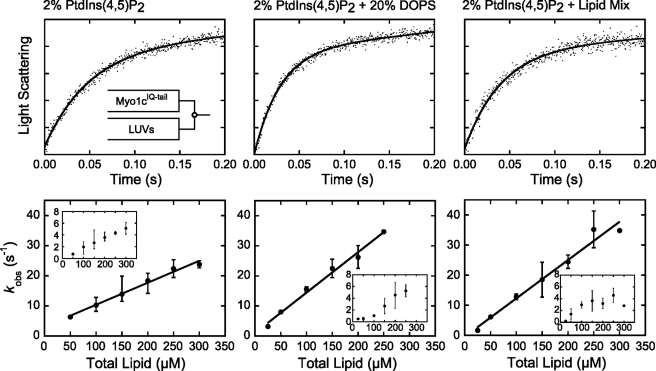
FIGURE 5.
Association of myo1cIQ-tail with LUVs. myo1cIQ-tail was rapidly mixed with LUVs composed of 2% PtdIns(4,5)P2 (left), 2% PtdIns(4,5)P2 + 20% DOPS (center), and 2% PtdIns(4,5)P2 + Lipid Mix (right). Top, experimental time courses of light scattering changes after mixing myo1cIQ-tail with LUVs. Time courses (dots) are blank subtracted averages of traces at final reaction concentrations of 250 nm myo1cIQ-tail and 250 μm total lipids. Solid lines are the best fits of the data to a two-exponential function. Bottom, rates of kfast (closed symbols) and kslow (inset) are plotted as a function of total lipid concentration. Each data point represents the average of 1–4 experiments (each the average of 2–6 transients), and the error bars report the range of values. The solid lines represent linear fits to the data.

