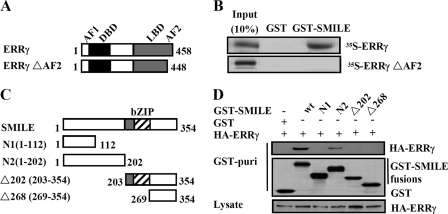
FIGURE 3.
Interaction domains of ERRγ and SMILE. A, schematic representation of the structures of ERRγ mutants. AF1, activation function-1 domain; DBD, DNA binding domain. The numbers in the figure indicate the amino acid (aa) residues. B, SMILE interacts with the AF2 domain of ERRγ. 35S-Radiolabeled ERRγ or ERRγΔAF2 proteins were incubated with GST or GST-SMILE fusion proteins. Protein interactions were detected via autoradiography. C, schematic representation of the structures of SMILE mutants. The numbers in the figure indicate the amino acid residues. D, in vivo interaction assays between ERRγ and SMILE mutants. HepG2 cells were cotransfected with expression vectors for HA-ERRγ and pEBG alone (GST) or pEBG-SMILE (GST-SMILE) fusions as indicated. Protein interactions were examined via in vivo GST pulldown. The top and middle panels (GST puri) show GST bead-precipitated HA-ERRγ and GST fusions, respectively. The bottom panel shows the protein expression levels of HA-ERRγ in cell lysates. wt, wild-type. The data shown are representative of at least three independent experiments with similar results.

