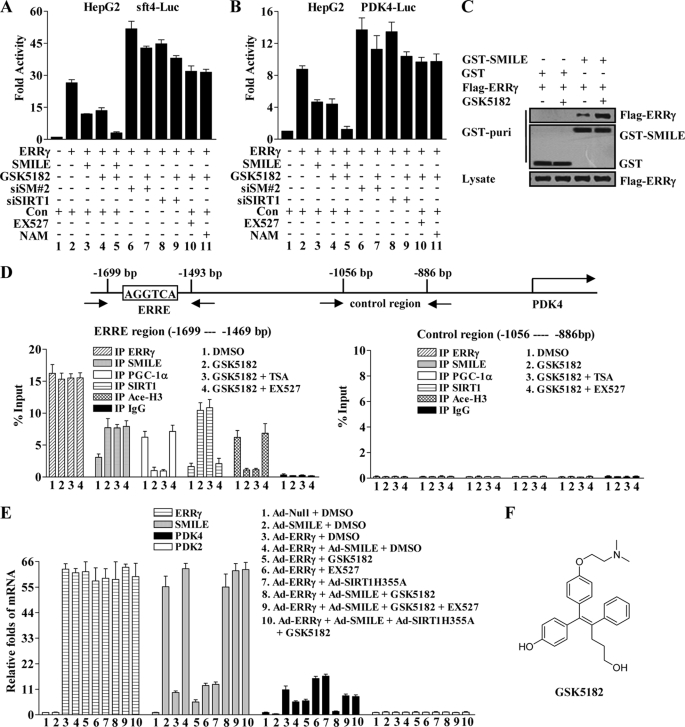
FIGURE 6.
ERRγ inverse agonist GSK5182 enhances SMILE to down-regulate ERRγ target PDK4. A and B, GSK5182 represses ERRγ transactivation in a SMILE and SIRT1-dependent manner. HepG2 cells were transfected with pSUPER siSMILE-II (siSM#2), siSIRT1, or pSUPER (Con) as indicated. 24 h after transfection, the cells were cotransfected with 0.1 μg of indicated reporter plasmids, sft4-Luc (A) or PDK4-Luc (B) and 0.2 μg of pcDNA3-FLAG-ERRγ, together with or without 0.1 μg of pcDNA3-FLAG-SMILE (A–C). 36 h after transfection, the cells were treated with chemicals (1 μm GSK5182, 10 μm EX527, or 20 mm nicotinamide (NAM)) as indicated for 12 h prior to the measurement of luciferase activity. The means ± S.D. (n = 3) of a representative experiment are shown. C, GSK5182 treatment intensifies the interaction between ERRγ and SMILE. HepG2 cells were cotransfected with pcDNA3-FLAG-ERRγ and pEBG-SMILE (GST-SMILE) or pEBG alone (GST), and 36 h after transfection, the cells were treated with or without 1 μm GSK5182. Cell extracts were prepared and subjected to in vivo GST pulldown assays in the absence or presence of GSK5182 as indicated. The top and middle panels (GST puri) show GST bead-precipitated FLAG-ERRγ and GST fusions, respectively. The bottom panel shows the protein expression levels of FLAG-ERRγ in the cell lysates. D, recruitment of SMILE by GSK5182 on PDK4 promoters is correlated with PGC-1α dissociation and histone 3 deacetylation in ChIP assays. HepG2 cells were treated with or without indicated chemicals (0.1% DMSO, 1 μm GSK5182, 0.3 μm TSA, and 10 μm EX527). Chromatin fragments prepared from the treated HepG2 cells were immunoprecipitated with the indicated specific antibodies. Unrelated immunoglobin G (IgG) was used as a negative control. DNA fragments covering an ERRE on human PDK4 promoter are indicated in the upper panel. The occupancy of ERRγ, SMILE, PGC1α, SIRT1, and acetylated histone H3 (Ace-H3) on the ERRγ-binding region (lower left panel) was analyzed by amplifying the corresponding regions using quantitative real time PCR. A control region on the PDK4 promoter was used to check the specific binding of those proteins (lower right panel). Data are representative of at least two independent IP and three independent PCR amplifications. Values are presented as mean ± S.D. E, relative mRNA expression levels of ERRγ, SMILE, PDK4, and PDK2 analyzed by quantitative real time PCR (standardized using β-actin). Normalized basal levels of each transcript were assigned an arbitrary value of 1.0 for comparison. HepG2 cells were infected with indicated adenovirus vector (Ad-Null, Ad-ERRγ, Ad-SMILE, and Ad-SIRT1H355A) at a concentration of 100 plaque-forming units/cell. After 36 h of infection, the cells were stimulated with or without indicated chemicals (0.1% DMSO, 1 μm GSK5182, and 10 μm EX527) for 12 h before total RNA were isolated. Data shown are representative of three independent experiments. F, structure of ERRγ inverse agonist GSK5182.

