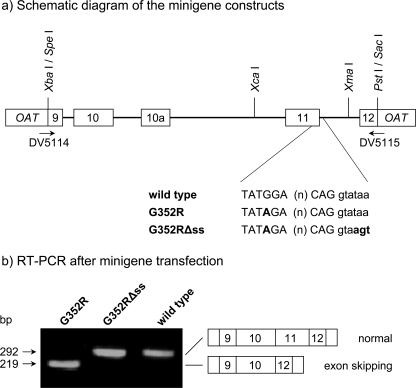
FIGURE 3.
In vivo splicing analysis. Boxes represent exons, and dark horizontal lines represent introns. The relevant portion of exon 11 and its 3′-flanking splice site is shown for three minigene constructs: wild type, c.1054G→A (G352R), and c.1054G→A with the optimized donor splice site (G352RΔss). Intronic sequences are shown in lowercase, and mutated nucleotides are shown in bold. a, schematic diagram of the three minigene constructs and the primers used for RT-PCR analysis. b, RT-PCR products after transfecting MCCB-deficient reference fibroblasts with the indicated minigene constructs and the corresponding exon arrangements.

