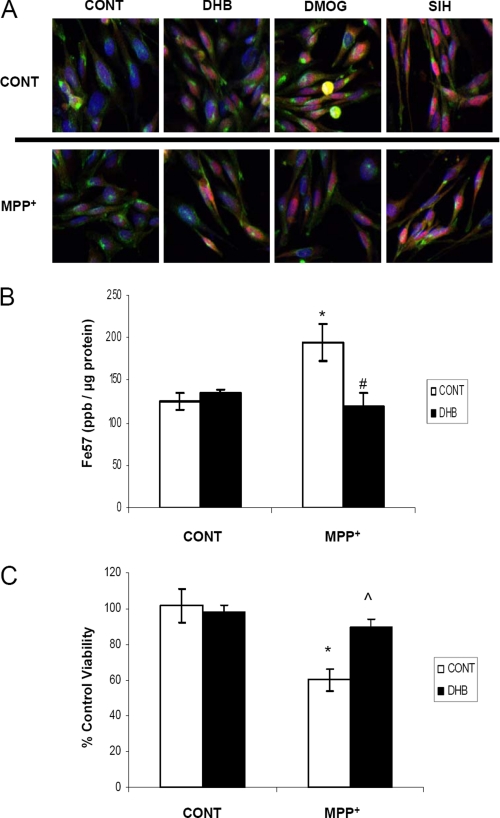
FIGURE 8.
In vitro studies in SN DA-derived N27 cells. A, N27 cells grown in 3% O2 were treated with 200 μm DHB, 200 μm DMOG, or 100 μm SIH in the presence of 400 μm MPP+ for 24 h. Cells were then fixed with 4% paraformaldehye and stained with transferrin receptor (green), HIF-1α (red), and 4′,6-diamidino-2-phenylindole (nuclear marker, blue); pink staining represents nuclear localization of HIF-1α. B, cells were labeled with 57Fe for 24 h, treated with 200 μm DHB ± 400 μm MPP+, and then digested with nitric acid for ICP-MS analysis of total iron measurements (mean ± S.D.; n = 4). Asterisk denotes p < 0.05 between control/control and DHB/control; # denotes p < 0.05 between control/MPP+ and DHB/MPP+. C, cells were treated with 800 μm MPP+ for 24 h in the presence and absence of 200 μm DHB. The 3-(4,5-dimethylthiazol-2-yl)-2,5-diphenyltetrazolium bromide assay was used as a measure of cell viability. *, p < 0.005 between control/control and control/MPP+; ⋀, p < 0.001 between control/MPP+ and DHB/MPP+ (mean ± S.D.; n = 4).

