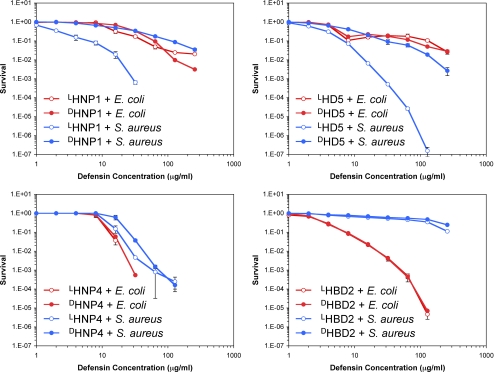
FIGURE 5.
Survival curves of E. coli ATCC 25922 (red) and S. aureus ATCC 29213 (blue) exposed to l- (empty circles) and d-defensin (filled circles). Strains were exposed to the peptides at concentrations varying 2-fold from 1 to 256 μg/ml. Each curve is the mean of two (HNP1, HD5, and HBD2) or three (HNP4) separate experiments, where the error bars represent the ±S.D. of the measurements. Points scored as zero survival could not be plotted.

