FIGURE 2.
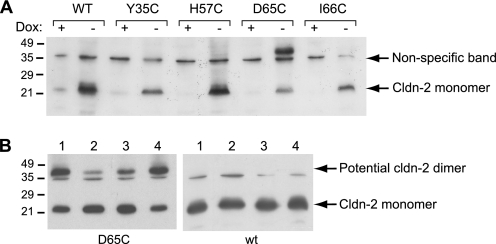
Western blot analysis of claudin-2 in cell lysates isolated from cell lines expressing WT claudin-2 and cysteine mutants. A, claudin-2 appears as a band at ∼22 kDa in induced cells (Dox−), whereas expression is suppressed in the presence of doxycycline (Dox+). An additional band at between 40 and 45 kDa was observed with cells induced to express the D65C mutant of claudin-2. (The band at ∼35 kDa present in all lanes represents nonspecific antibody binding.) All samples were prepared with reducing sample buffer, containing 1% (v/v) 2-mercaptoethanol. B, testing the identity of the high molecular mass band at 40–45 kDa. Lysates of D65C and WT cells without pretreatment were prepared for SDS-PAGE using non-reducing sample buffer (lane 1) or reducing sample buffer (lane 2). Alternatively, intact cell monolayers were pretreated with 10 mm dithiothreitol (lane 3) or 110 mm Cu(II)-phenanthroline (lane 4) for 5 min to reduce and oxidize cysteines, respectively. The reagents were vigorously washed off prior to cell lysis, and samples were prepared with non-reducing buffer. The blot shows that preparation of the sample under reducing conditions or pretreatment of the cells with reducing reagent decreases the high molecular mass band.

