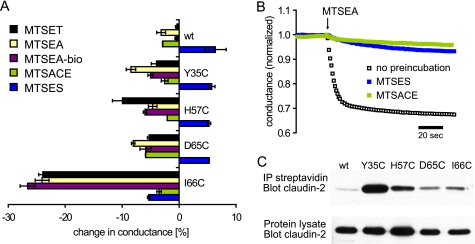
FIGURE 6.
A, quantification of SCAM conductance measurements. The diagram shows the relative changes in conductance of WT and mutant claudin-2 induced by different MTS reagents. The data are means of three filters ± S.E. of representative experiments, measured 3 min after the addition of MTS. B, testing the reaction of MTSES and MTSACE with I66C. Cells expressing I66C were preincubated with either MTSES or MTSACE for 5 min prior to the addition of MTSEA. Control cells were not preincubated. Preincubation with either MTSES or MTSACE largely prevented the inhibition of conductance by MTSEA. C, Western blot of claudin-2 to test the reaction of endogenous and engineered cysteines with MTSEA-biotin. Intact cell layers were incubated with MTSEA-biotin, and cells were homogenized with radioimmune precipitation buffer. Samples were taken from the whole cell lysate to test overall claudin-2 expression (bottom). Biotin-labeled proteins were affinity-purified with streptavidin-coated agarose beads, and biotinylated claudin-2 was detected using a claudin-2-specific antibody (top).

