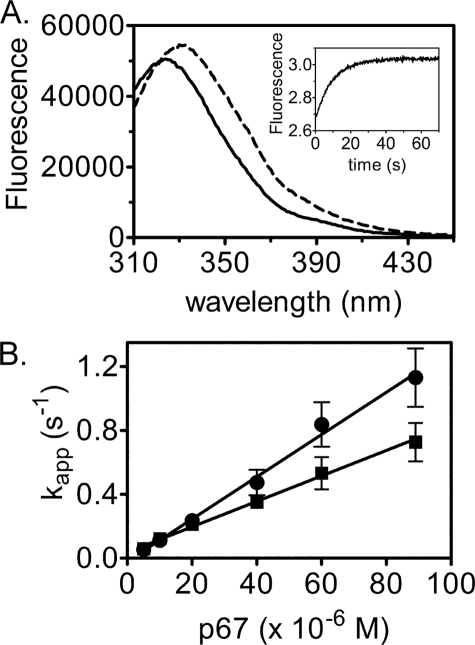
FIGURE 7.
Single turnover measurements of biotin transfer from bio-5′-AMP to p67. A, fluorescence emission spectra of 1 μm 58-HCS, 0.5 μm biotin, and 100 μm ATP before (solid line) and after (dashed line) addition of 10 μm p67. Inset, representative stopped flow fluorescence trace obtained upon mixing 1 μm 58-HCS, 0.5 μm biotin, and 100 μm ATP with 20 μm p67. B, dependence of the apparent association rate of FL-HCS-bio-5′-AMP (●) or 58-HCS-bio-5′-AMP (■) with p67 on acceptor protein concentration. Error bars represent the mean ± S.E. of at least five measurements performed at each [p67].

