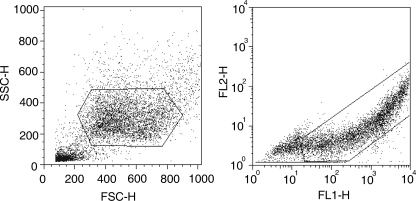
FIGURE 2.
FACs analysis for measuring cellular fluorescence. Left, cells with the right forward (FSC) and side scatter (SSC) were selected by gating. Right, EGFP-positive cells selected were measured for fluorescence emission through the FL1 (530 nm) and FL2 (583 nm) channels. This allowed p53-transfected cells to be distinguished from non-transfected ones. The fluoresence intensity of 10,000 individual cells was measured, and the average fluorescence intensity was recorded.

