FIGURE 1.
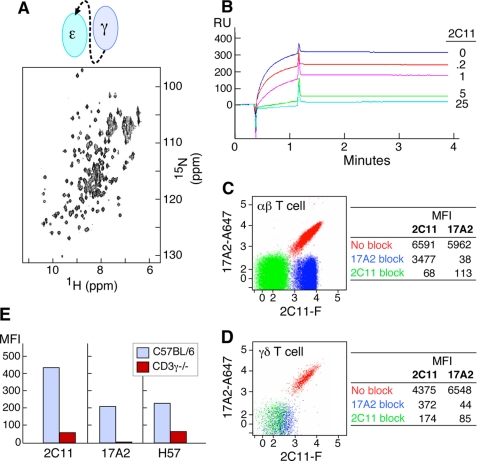
Specificity of anti-CD3 mAbs. A, 15N-1H two-dimensional HSQC spectrum of recombinant CD3ϵγ (schematically represented) is stable under physiological conditions (pH 7.4, phosphate-buffered saline). B, SPR analysis of competitive scCD3ϵγ binding between 17A2 and 2C11. Direct binding between recombinant CD3ϵγ (1 μm) and surface-bound 17A2 was measured using a BIA3000 Biosensor. Sensorgrams without and with 2C11 pre-addition to the CD3ϵγ protein are shown (numbers represent antibody to CD3ϵγ protein molar ratios). C and D, binding competition between 17A2 and 2C11 on the T cell surface. LNs were isolated from C57BL/6 mice. mAbs against T cell surface markers including CD3 were used for flow cytometric analysis. Each dot represents 2C11-FITC (2C11-F) and 17A2-Alexa 647 (17A2-A647) binding after unlabeled 17A2 blocking (blue), 2C11 blocking (green), or no blocking (red). CD4 single-positive αβ TCR-positive or γδ TCR-positive populations were gated for analysis. Data are representative of three independent experiments and plotted on a 5 log scale (0–5). MFI values are given in the tables for binding of each fluorochrome-labeled antibody without or with the indicated unlabeled mAb blockade. E, differential binding of 17A2 to thymocytes of wild type (blue) and CD3γ−/− (red) mice. CD4 single-positive thymocytes were gated for analysis. H57 recognizes the FG loop in the constant region of TCRβ (24).

