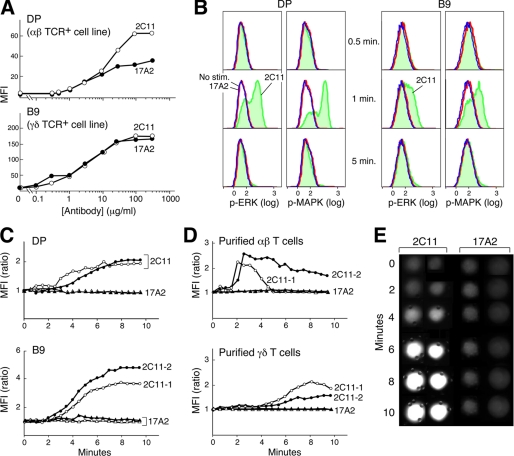
FIGURE 2.
Differential functional activation of T cells by anti-CD3 mAbs. A, flow cytometry analysis with MFI binding quantitation of 2C11-FITC and 17A2-FITC at varying concentrations to DP (αβ TCR+) and B9 (γδ TCR+) cell lines. B, phosphorylation states of ERK or MAPK after 2C11- or 17A2-coupled bead stimulation (blue = no stimulation; red = 17A2 stimulation; green = 2C11 stimulation). C and D, intracellular calcium dynamics upon interaction with 2C11- or 17A2-coupled beads. Circles represent cells stimulated by 2C11 beads and triangles represent cells stimulated by 17A2 beads (two independent measurements are shown for each with open and filled symbols). For calcium flux experiments, γδ and αβ T cells were purified from LNs of TCRβ−/− and CL57BL/6 mice, respectively, as described. Time 0 = time of bead addition to cells. E, microscopic images of calcium flux in individual cells using Fluo-4 and microscopy as described under “Experimental Procedures.” Fluo-4 responses were quantified by determining the average intensity of a region within each cell as a function of time using the Image J program (NIH). Results are representative of the 64 individual T cells analyzed. Two-tailed t test analysis was performed to compare MFI values from 64 T cells. The increase in intracellular free calcium levels induced by 2C11 beads was significantly different from those induced by 17A2 beads (i.e. p < 0.05 at 6 min).

