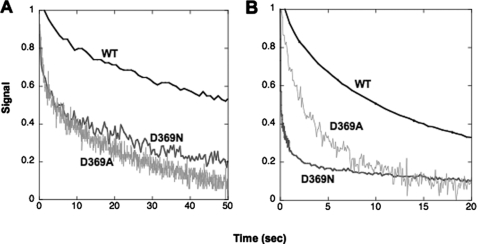
FIGURE 11.
Stopped-flow traces of rates of phosphate- and vanadate-induced E1 → E2 conformational changes for wild type and D369N/D369A mutants. A, phosphate: wild type (WT) and D369N, 25 mm phosphate (Tris), 4 mm MgCl2, D369A, 25 mm phosphate (Tris). B, vanadate: wild type and mutants 1 mm vanadate (Tris), 4 mm MgCl2. Traces represent averages of 4–8 replicates and are fitted to a double exponential function; see Table 5.

