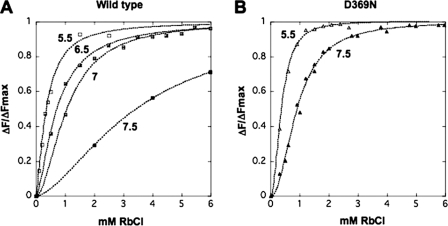
FIGURE 8.
Equilibrium titrations of E1 ↔ E2(Rb) at varying pH. A, wild type; B, D369N. The data have been normalized as described under “Experimental Procedures.” Solid lines represent curves fitted to these data and provide the parameters in Table 4. At pH values lower than 7.0, a linear drift was subtracted from the fluorescence signal changes.

