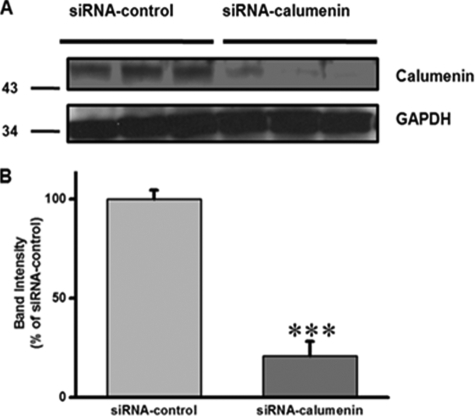
FIGURE 2.
Calumenin knockdown in HL-1 cells. HL-1 cells were transfected with siRNA-control or siRNA-calumenin oligonucleotides. A, 72 h after transfection, protein sample was prepared, and immunoblotting was done using anti-calumenin and anti-glyceraldehyde-3-phosphate dehydrogenase (GAPDH) antibodies. B, band intensities were measured and presented as a percentage of siRNA-control cells. Data represent means ± S.E., n = 3 and ***, p < 0.001 versus siRNA-control.

