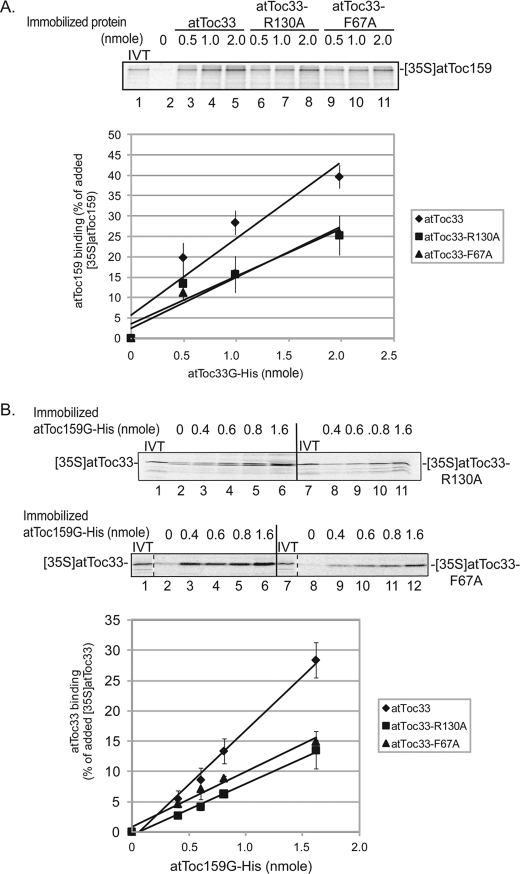
FIGURE 3.
Binding of atToc33-R130A and atToc33-F67A to atToc159. A, increasing concentrations of immobilized atToc33G-His6, atToc33G-R130A-His6, or atToc33G-F67A-His6 were incubated with full-length in vitro translated [35S]atToc159. 10% of the in vitro translation (IVT) products added to each reaction is indicated in lane 1. B, increasing concentrations of immobilized atToc159G-His6 were incubated with full-length in vitro translated [35S]atToc33, [35S]atToc33-R130A, or [35S]atToc33-F67A. 10% of the in vitro translation products added to each reaction is indicated in lanes 1 and 7. The graphs correspond to the quantitative analysis of bound proteins from triplicate experiments of the representative data shown in the upper panels in both A and B. The error bars correspond to S.D.

