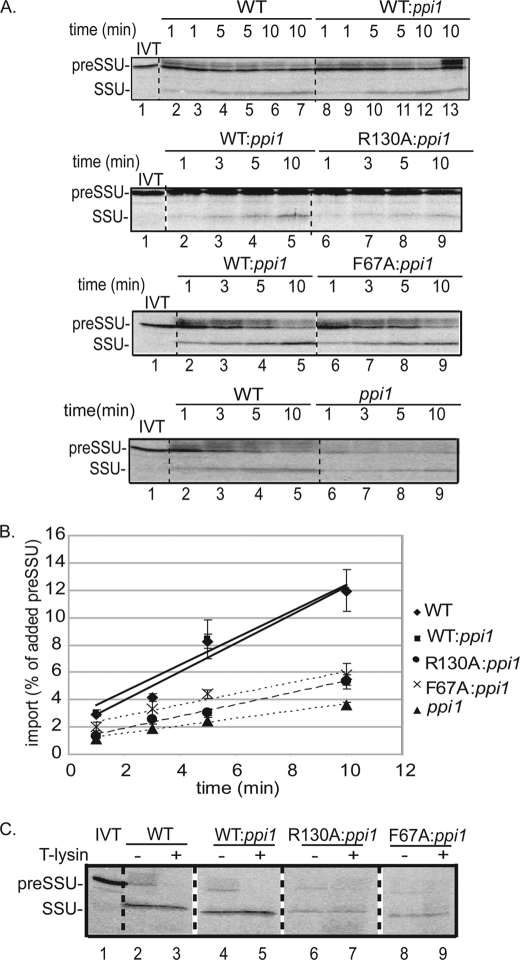
FIGURE 6.
atToc33-R130A and atToc33-F67A chloroplasts exhibit a decreased rate of protein import. A, isolated chloroplasts from the indicated plants were incubated with [35S]preSSU in the presence of 1 mm GTP and 2 mm ATP at 23 °C for the indicated times. B, quantitation of the data from triplicate experiments is presented in the graph. Lane 1 in each panel represents 20% of the in vitro translation (IVT) products added to each reaction. C, chloroplasts from a [35S]preSSU 10-min import reaction in A were treated with 100 μg/ml thermolysin on ice for 30 min to discriminate between bound and fully imported proteins. The position of [35S]preSSU (20 kDa) and imported mature SSU (13.5 kDa) are indicated at the left of each panel. Dashed lines indicate that the illustrations were generated from different regions of the same SDS-polyacrylamide gel using samples from the same experiment. The error bars correspond to S.D.

