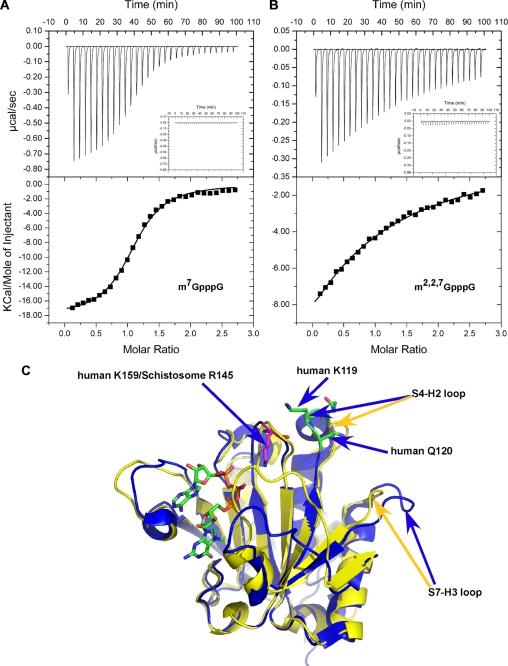
FIGURE 6.
ITC analysis of schistosome eIF4E cap binding and conformational differences between schistosome and human eIF4E. A, m7GpppG titration. B, m2,2,7GpppG titration. The top panels show the raw data, and the bottom panels show the integrated data with the continuous lines representing the fit of the data to a single site binding model. The insets in the upper panels represent buffer injection alone. Similar values were obtained with m7GTP and m2,2,7GTP. C, structural comparison of human (blue) and schistosome (yellow) eIF4Es around H2-S4 loop.

