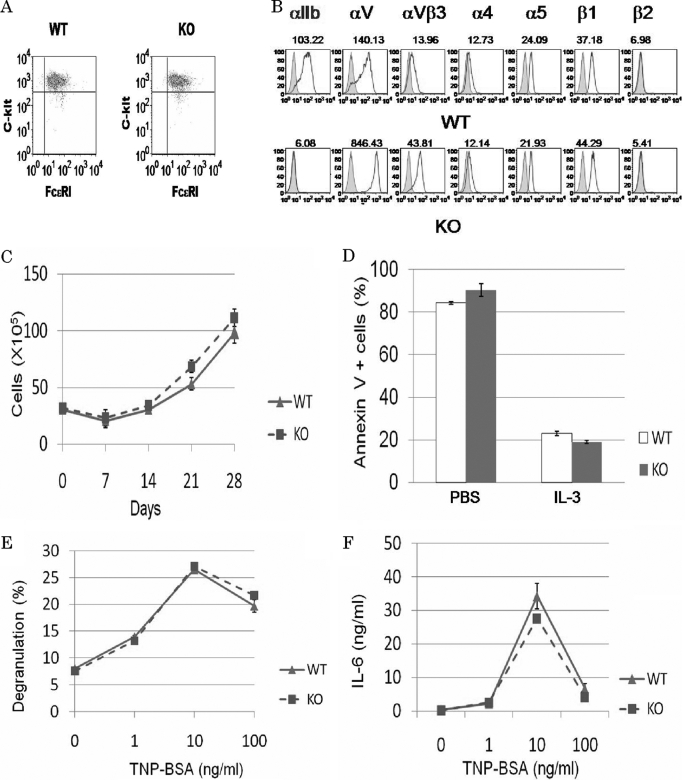
FIGURE 1.
Functional analysis of WT and integrin αIIb-deficient BMMCs in in vitro suspension culture. A and B, surface expression levels of FcϵRI and c-kit as well as several integrins such as integrin αIIb, αV, αVβ3, α4, α5, β1, and β2 in WT and integrin αIIb-deficient BMMCs. Mean fluorescent intensities of staining were indicated. Data are representative of three independent experiments. C, in vitro growth curves of bone marrow cells derived from WT and integrin αIIb-deficient mice. Numbers of trypan blue-excluding cells in bone marrow cell cultures in IL-3-containing medium were counted weekly. Data are representative of three independent experiments. All data points correspond to the mean ± S.D. D, IL-3 deprivation-induced apoptosis of WT and integrin αIIb-deficient BMMCs. Percentage of annexin V-positive cells after 48 h was measured by flow cytometric analysis. Data represent three independent experiments. All data points correspond to the mean ± S.D. E and F, after IgE-sensitized WT and integrin αIIb-deficient BMMCs were stimulated with the indicated concentrations of antigen for 50 min or 24 h, the amounts of β-hexosaminidase (E) or IL-6 (F), respectively, released into medium were measured. Data represent three independent experiments. All data points correspond to the mean ± S.D.

