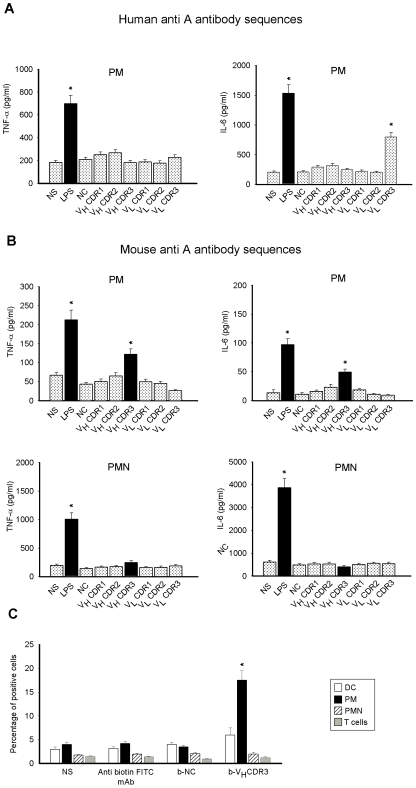
Figure 1. TNF-α and IL-6 production by PM and PMN stimulated with human and/or mouse CDRs and mouse VHCDR3 uptake by different cell populations.
PM (A) or PM and PMN (B) (both 5×10⁶/ml) were cultured in the presence or absence (NS) of human and/or mouse CDRs, LPS, or NC (all 10 µg/ml) for 18 h. After incubation, TNF-α and IL-6 levels were evaluated in culture supernatants by specific ELISA assays. *, P<0.05 (treated vs untreated cells, n = 7). DC, PM, PMN, and T cells (all 1×10⁶/ml) were incubated for 1 h in the presence or absence (NS) of b-VHCDR3 or b-NC (both 10 µg/ml). After incubation, permeabilized cells were reacted with FITC-labelled mAb to biotin and analyzed by FACScan flow cytometry. Data are reported as the percentage of positive cells (C). *, P<0.05 (b-VHCDR3 treated vs untreated cells, n = 5). Error bars, s.e.m.

