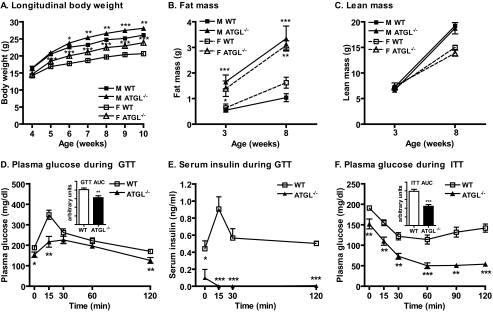
FIGURE 1.
Body weight, body composition, glucose tolerance, and insulin sensitivity. A, body weight of male (M) and female (F) WT and ATGL−/− mice (n = 16–41 per group). B, total body fat mass, and C, lean mass of WT and ATGL−/− mice as assessed by EchoMRI (n = 3–17 per group). D, GTT, plasma glucose in 7–8-h fasted male mice at 8–10 weeks of age following intraperitoneal administration of 1.5 g of glucose/kg of body weight (n = 8–18 per group). E, serum insulin following administration of 1.5 g of glucose/kg of body weight in a separate cohort of 7–8 week-old mice of mixed gender (n = 4–5 per group). Experimental conditions and blood glucose curves were comparable with the GTT shown in D. F, ITT, plasma glucose in 7–8-h fasted male mice at 7–9 weeks of age following intraperitoneal administration of 0.75 units of insulin/kg of body weight (n = 8–18 per group). For both ITT and GTT, the areas under the curve are shown (D and F, insets). Data are expressed as mean ± S.E. *, p < 0.05; **, p < 0.01; ***, p < 0.001 for effect of genotype as determined by unpaired two-tailed Student's t test.

