FIGURE 8.
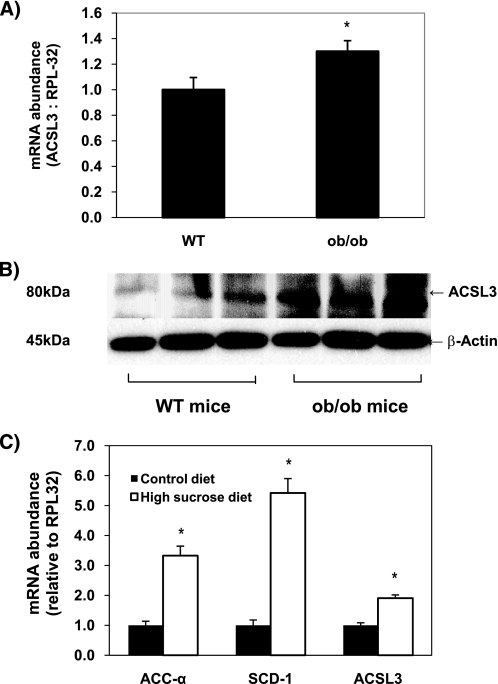
Expression of ACSL3 is up-regulated in ob/ob mice and C57/BL6 mice fed a high sucrose diet. A and B, expression of ACSL3 was compared in liver tissue of 5-week-old male ob/ob (n = 5) and lean wild-type (WT) C57/BL6 mice (n = 4) fed chow diets. A, total RNA was extracted, and the abundance of mRNA for ACSL3 was quantified using quantitative RT-PCR and normalized to RPL-32. *, p < 0.05 when compared with WT mice. B, total proteins were subjected to Western blot, and expression of β-actin was analyzed as an internal control. C, expression of ACSL3 was compared in liver tissue of 5-week-old male C57/BL6 mice (n = 4 per group) fed AIN-93 diet (control diet) or high sucrose (45%) diet for 1 week. Values are reported as mean ± S.E. and are expressed relative to the mice fed the control diet. *, p < 0.05 when compared with control diet.

