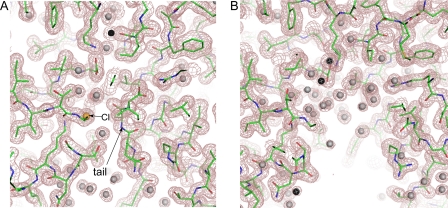
FIGURE 5.
A cutaway view of the active site cleft in the closed (A) and open (B) conformations. The structures and the |2Fo − Fc| electron density map contoured at 1σ (shown by the violet mesh) correspond to structures b and a from Fig. 3, respectively. The C-terminal tail and the chloride (orange sphere) are shown by the arrows.

