FIGURE 2.
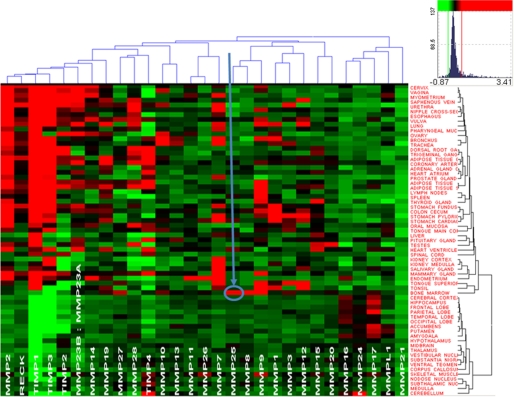
MMP-25 is uniquely enriched in the bone marrow. Heat map and the hierarchical bi-clustering of the expression data (log10 of expression level) of MMPs and their natural inhibitors TIMPs and RECK (Vertical clustering, by the level of expression in the individual tissue types. Right, horizontal clustering, by gene expression levels, on the top). The data were derived from 356 gene arrays of 65 normal tissue types. Red and green correspond to the high and the low expression levels, respectively. Black represents an average level of expression. Color map inset shows the distribution (frequency) of different gene expression levels in the set and related colors. Arrow points to MMP-25 in the bone marrow.

