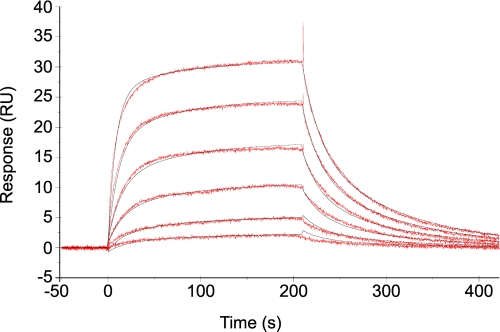
FIGURE 5.
Kinetic analysis of tRNA binding to immobilized mMbSerRS R143A monitored by a biosensor. Sensorgrams (red) were obtained for the binding of different concentrations of tRNASer (70.3–2250 nm) in 30 mm Hepes, pH 7.0, 6 mm MgCl2, and 5 mm DTT to R143A mMbSerRS. Data were fit to the two-state conformational change model (black).

