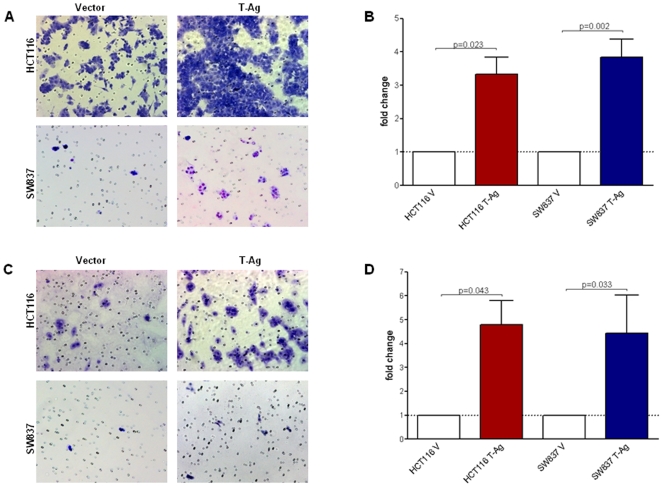
Figure 2. JCV T-Ag increases migration and invasion in vitro.
Migration and invasion assays were performed in Boyden chambers without and with Matrigel respectively. Representative images from one of the three independent experiments showing migration (A) and invasion (B) in control and T-Ag transfected HCT116 and SW837 cell lines (200× magnification). The bar graphs in panels B and D are quantitative determinations of data obtained using ImageJ cell counter software from 3 independent experiments. As indicated, T-Ag transfection (red and blue bars) showed significantly increased migration and invasion (p<0.05) in both cell lines.

