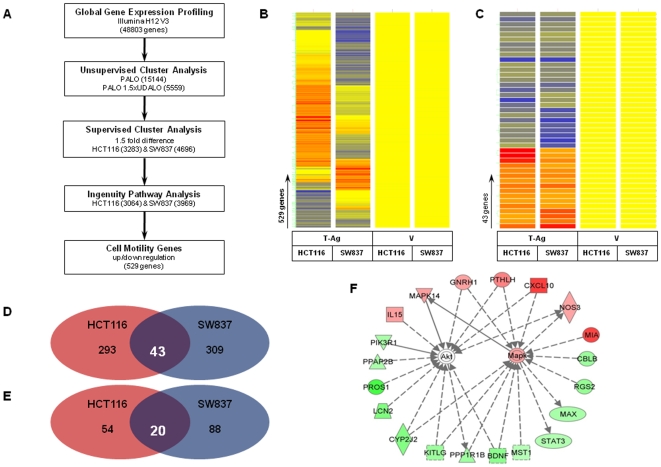
Figure 3. Global gene expression analysis of JCV T-Ag transfected cells.
(A) The flow chart represents the strategy used for gene expression analysis. Using unsupervised analysis we selected 5559 genes. Dendograms in panels B and C illustrate clustering analysis of JCV-T-Ag transfected cells compared to vector controls. Gene trees are represented on the horizontal axis, while condition trees are represented on the vertical axis. The color conventions for all maps are as follows: red indicates over-expressed transcripts, blue are under-expressed transcripts, and yellow indicates transcripts that did not deviate from the controls. Clustering analysis in panel B illustrates Ingenuity pathway analysis which revealed 529 genes that are involved in regulation of cell motility. Of these, a subset of 43 genes that are specifically involved in migration or invasion and were up- or down-regulated in both cell lines are shown in panels C (as dendogram) and D (Venn diagram). Of this group of 43 genes, 20 genes that are directly or indirectly involved in AKT and MAPK pathways were shared between both HCT116 and SW837 cells as shown in panel E (Venn diagram) and panel F (as a schematic interaction of individual genes with each other). Red indicates up-regulated and green indicates down-regulated genes following T-Ag transfection (panel F).

