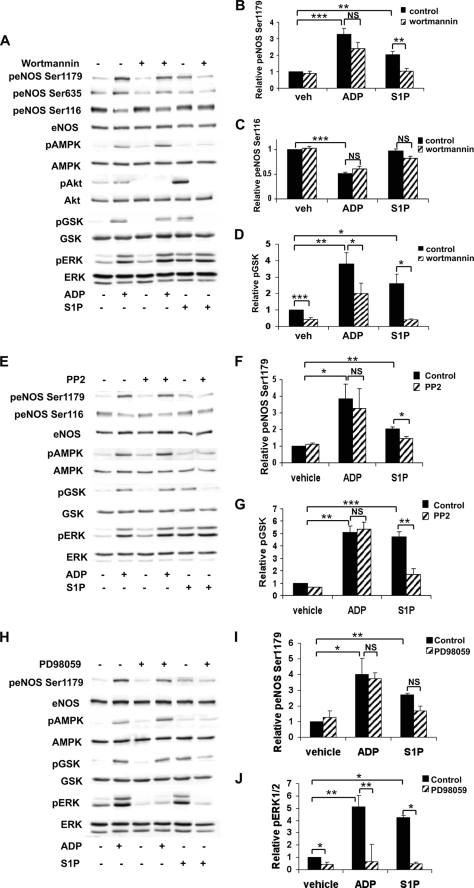
FIGURE 3.
Differential effects of pharmacologic inhibition of PI3K/Akt, Src tyrosine kinase, and ERK1/2 pathways on ADP- and S1P-mediated phosphorylation responses in endothelial cells. A, lysates from BAEC were prepared from cells pretreated with the PI3K inhibitor wortmannin (500 nm) for 30 min and then treated with ADP (50 μm) or S1P (100 nm) for 5 min. Cell lysates were resolved by SDS-PAGE and probed with the antibodies indicated. Shown is an immunoblot representative of five individual experiments that yielded equivalent results. Quantitative analysis using digital chemiluminescence shows the relative phosphorylation of eNOS Ser1179 (B), eNOS Ser116 (C), and GSK3β (D). E, cells were pretreated with PP2 (10 μm) for 30 min and then stimulated with ADP (50 μm) or S1P (100 nm) for 5 min. This panel shows an immunoblot that is representative of results obtained from three independent experiments. F and G show the quantitation of pooled data presenting the relative phosphorylation of eNOS Ser1179 and GSK3β, respectively. H, cells were preincubated for 30 min with PD98059 (50 μm) and then treated for 5 min with ADP (50 μm) or S1P (100 nm). Cell lysates were resolved by SDS-PAGE, and a representative immunoblot probed with the indicated antibodies is shown. This experiment was repeated three times with equivalent results. Relative phosphorylation of eNOS Ser1179 (I) and ERK1/2 (J) determined by quantitative chemiluminescence, analyzing pooled data from three experiments, is shown. The bars in each graph in this figure represent mean values ± S.E. with * indicating p < 0.05, ** indicating p < 0.01, and *** indicating p < 0.001. p, phospho; veh, vehicle; NS, not significant.

