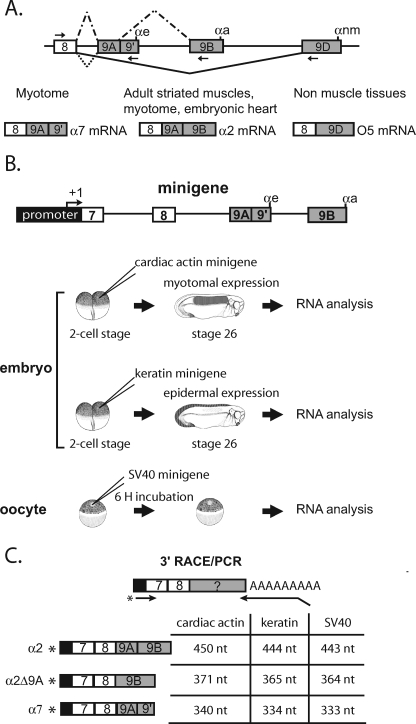
FIGURE 1.
Differential processing of the 3′-end of the Xenopus α-TM pre-mRNA. A, schematic diagram of the 3′-terminal region of the Xenopus α-TM pre-mRNA and of the different tissue-specific RNA processing patterns. Exons and introns are represented by boxes and horizontal lines, respectively. αe, αa, and αnm represent the poly(A) sites present within exons 9A9′, 9B, and 9D, respectively. The arrows represent the forward and reverse primers used to specifically RT-PCR-amplify the different RNA isoforms. The different RNA products in myotome, embryonic heart, adult striated muscle, and non-muscle tissues are indicated. B, diagrammed representation of the α-tropomyosin minigene and of the different in vivo expression assays using the Xenopus embryo and oocyte. C, schematic representation of the 3′-RACE/PCR assay. RNA was reverse transcribed with an oligo(dT) anchor primer. cDNA was further amplified with a reverse anchor primer and a radiolabeled forward primer that hybridize at the junction of the promoter and exon 7. Primers are indicated by arrows, and an asterisk marks the radiolabeling. The structure and size of all splicing products produced by the different minigenes are given.

