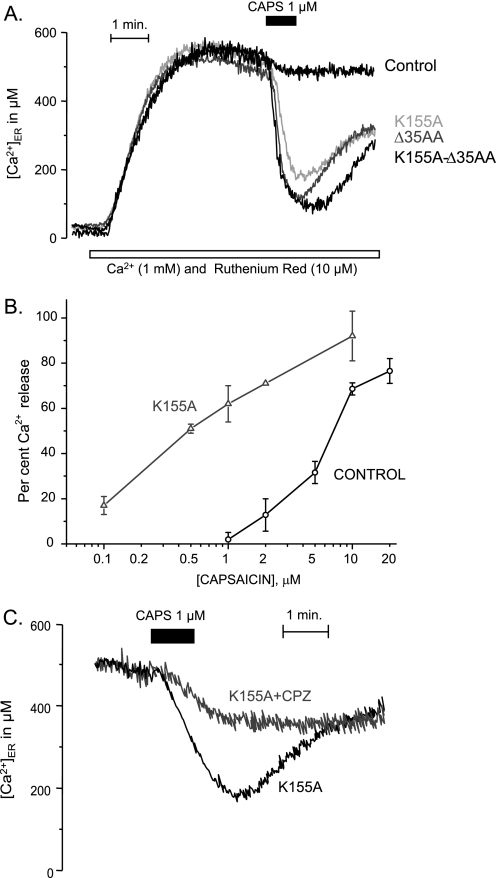
FIGURE 8.
Capsaicin-induced release of Ca2+ from the ER in HEK293T cells expressing different TRPV1 mutants. A, comparison of the Ca2+ release induced by capsaicin on the native TRPV1 (in black) and the mutants K155A, Δ35AA, and K155A/Δ35AA (different gray levels, as shown), all tested at 1 μm capsaicin. The empty plasmid vector, the control mutant R181A, or the unglycosylated N604S mutant did not increase the affinity for capsaicin (not shown). B, comparison of the dose response curves of the control (black) and the K155A mutant (gray). Shown are the average values of 3–14 determinations. Bars, S.E. C, stimulation by 1 μm capsaicin in K155A is antagonized by 10 μm capsazepine.

