FIGURE 5.
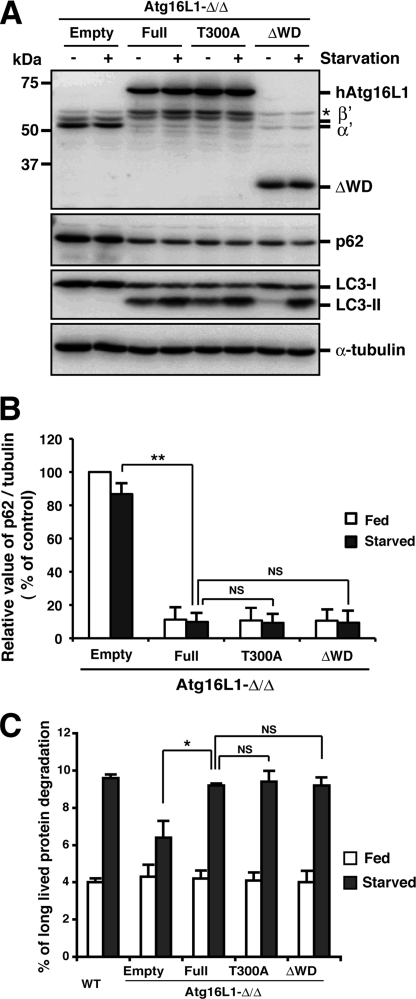
Impact of the Atg16L1 WD repeat deletion mutant and T300A mutant on autophagic degradation. A and B, Atg16L1-Δ/ΔMEFs expressing the indicated constructs were cultured in growth medium (+) or EBSS (−) for 1 h and then collected. Total cell lysate samples were examined by Western blot using each antibody. From top to bottom, panels represent anti-Atg16L1, anti-p62, anti-LC3, and anti-α-tubulin. The asterisk indicates a nonspecific immunoreactive band (A). The graph indicates the ratio between the intensity of the p62 band versus α-tubulin band expressed as a percentage of that in fed empty reconstituted cells. The average ± S.D. is shown for two independent experiments. Statistical analysis was performed by using Student's t test: **, p < 0.01; NS, not significant (B). C, wild-type or Atg16L1-Δ/ΔMEFs expressing the indicated constructs were grown in growth medium (Fed) or EBSS (Starved) for 2 h. Long-lived protein degradation was scored by a standard protocol. Each value represents the mean ± S.D. Statistical analysis was performed by Student's t test: *, p < 0.05; NS, not significant.

