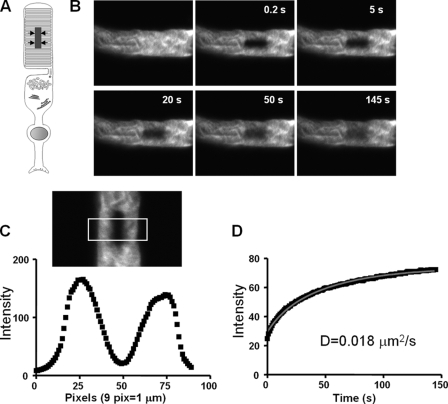
FIGURE 4.
Analysis of lateral diffusion of EGFP-PDE6C by FRAP. A, photobleaching geometry to monitor lateral diffusion. The arrows indicate the direction of diffusion into the bleached stripe region. B, pre- and postbleach images of a transgenic ROS at different time points. The retina was incubated in Ringer's buffer containing 6 mm 2-deoxyglucose and 10 mm NaN3. 150 images (256 × 256 pixels) were collected with a 1-s interval between the scans. C, intensity integrated along the y axis for each x axis pixel of the selected box region from the first postbleach image. The plot is used to determine the width of a bleach region with a Gaussian profile and the depth of bleach (21). D, intensities of the bleached region during the experimental time course corrected for background and fading and the fitting curve to a one-dimensional diffusion equation described previously (21).

