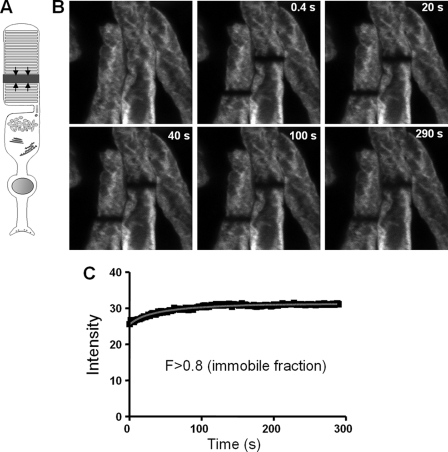
FIGURE 5.
Analysis of longitudinal diffusion of EGFP-PDE6C by FRAP. A, photobleaching geometry to monitor longitudinal diffusion. The arrows indicate the direction of diffusion into the bleached stripe region. B, bleaches were introduced into two neighboring rods. Pre- and postbleach images of transgenic ROS at different time points. The retina was incubated in Ringer's buffer containing 6 mm 2-deoxyglucose and 10 mm NaN3. 150 images (256 × 256 pixels) were collected with a 2-s interval between the scans. C, intensities of the bleached region from the left rod during the experimental time course corrected for background and fading and the fitting curve to a one-dimensional diffusion equation described previously (21).

