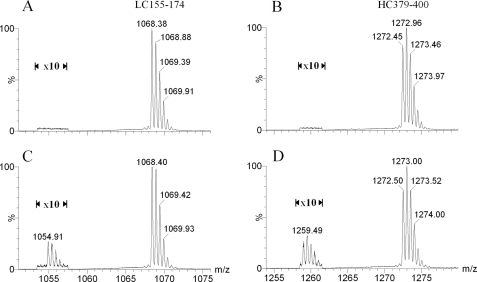
FIGURE 3.
Mass spectra of peptide LC 155–174 (A and C) and HC 379–400 (B and D) of antibody A. Only peaks in the doubly charged state are shown. A and B, shown are mAb A-1. C and D, shown is a batch from candidate cell line CL 24-34. The intensities of peaks near m/z 1055 and 1260 were increased 10-fold for easy viewing and comparison.

