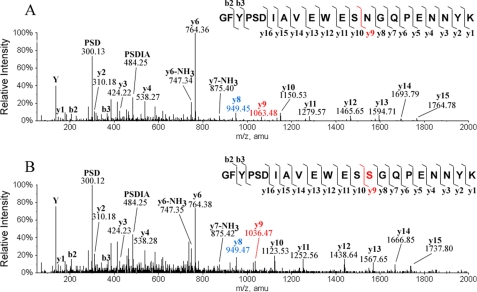
FIGURE 5.
MS/MS spectra of peptide 379–400 of antibody A. A, shown is the wild type peptide. B, shown is the peptide with an Asn → Ser substitution. The sequence of the peptide, the fragmentation pattern, and the detected fragment ions are shown at the top of each panel. y ions contain the C-terminal region of the peptide, and b ions contain the N-terminal region of the peptide. Calculated m/z values are y8 = 949.44 and y9 = 1063.48 when residue 387 is Asn, and y8 = 949.44 and y9 = 1036.47 when residue 387 in Ser.

