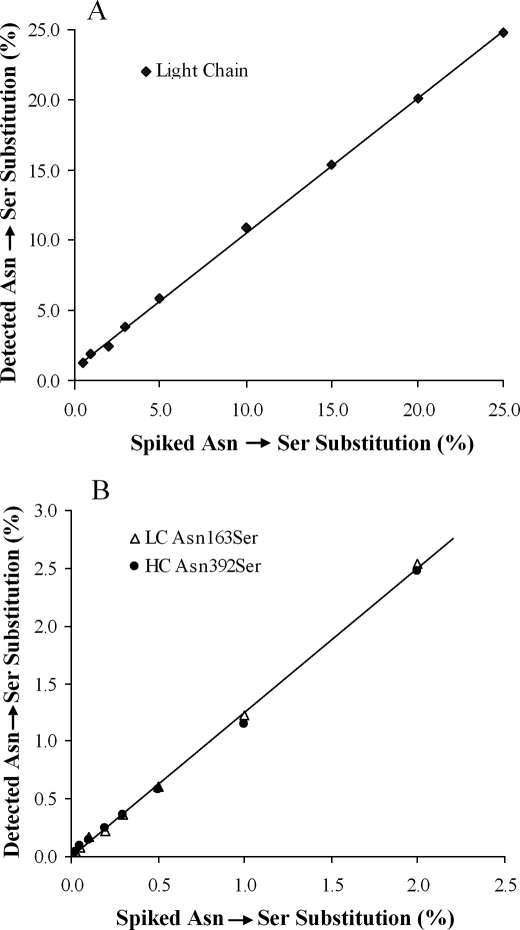
FIGURE 6.
Plots of the detected amounts of the Asn → Ser substitution in monoclonal antibody samples that were spiked with varying amounts of a monoclonal antibody with Asn → Ser mutations at residue 163 in the light chain and at residue 392 in the heavy chain. A, shown is intact mass measurement for the light chain of antibody A. B, shown is peptide mapping of antibody A. LC, light chain; HC, heavy chain.

