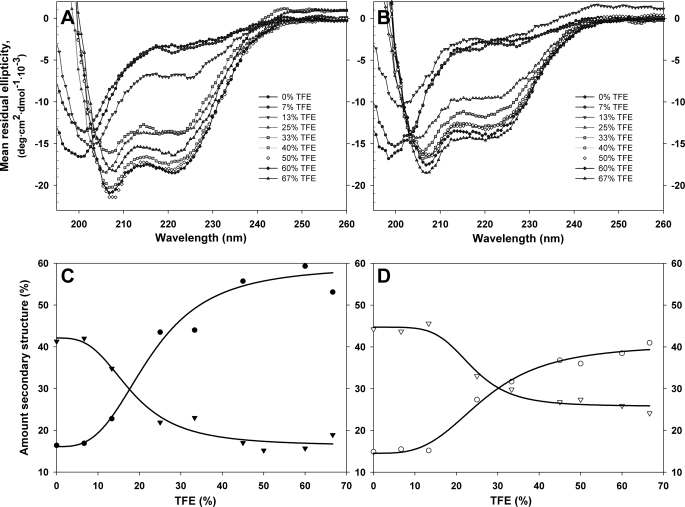
FIGURE 6.
Response of TH-(1–43) (A and C) and THp-(1–43) (B and D) to various amounts of TFE assessed by CD. Far-UV spectra of TH-(1–43) (A) and THp-(1–43) (B) in various amounts of TFE. Spectra were taken in 20 mm citric acid-phosphate, pH 7.4, and 25 °C. Peptide concentration was constant (16 μm) throughout both titrations. Shown is the amount (percentage) of random coil (▾ and ▿) and helix (● and ○) for TH-(1–43) (C, filled symbols) and THp-(1–43) (D, open symbols). The amount of secondary structure was estimated using the CDNN program (47), and the fittings (line) are logistic four-parameter curves that only aim to guide the eye.

