FIGURE 2.
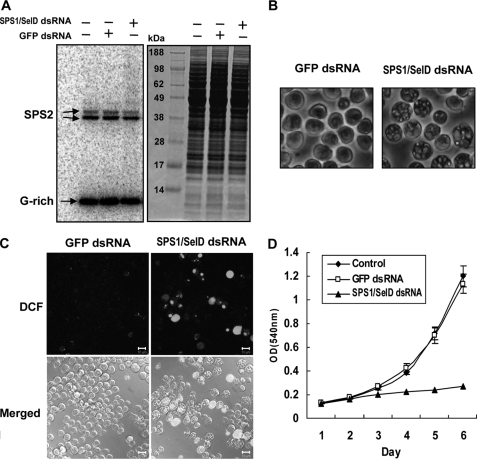
Phenotypic changes induced by SPS1/SelD knockdown. A, SPS1/SelD knockdown does not affect selenoprotein synthesis. Cells were labeled with 75Se, a protein extract was prepared, an aliquot of the extract was electrophoresed on a polyacrylamide gel, and the developed gel was exposed to a PhosphorImager for 3 h as described under “Experimental Procedures.” The panels represent an autoradiogram (left panel) and the corresponding gel stained with Coomassie Blue (right panel). B, SPS1/SelD knockdown induces VLGS formation. After treating SL2 cells with dsRNA, cells were examined under an inverted microscope and photographed with a CCD camera. Each panel shows the morphology of cells on day 4. The magnification was ×400. C, ROS were generated by SPS1/SelD knockdown. Four days after dsRNA treatment, cells were stained with 10 μm 2′,7′-dichlorofluorescein diacetate for 30 min at 25 °C and observed with a LSM510 confocal microscope. Scale bars represent 10 μm. D, effect of SPS1/SelD loss on cell growth. The growth rate was examined by MTT assay in GFP or SPS1/SelD dsRNA-treated cells as described under “Experimental Procedures.” Control cells were not transfected with dsRNA. Experiments were performed in triplicate, and error bars denote the standard deviation from the mean of three independent experiments.

