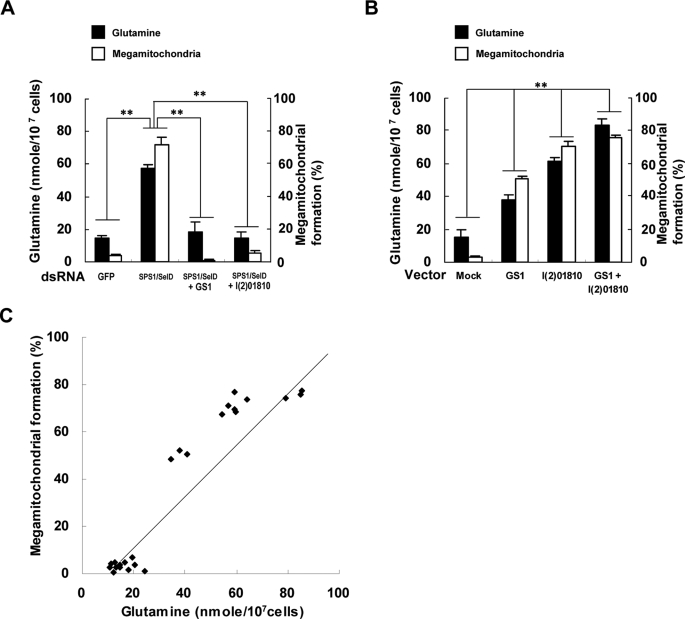
FIGURE 7.
Co-relationship between the formation of megamitochondria and intracellular glutamine level. A, frequency of cells forming megamitochondria and the intracellular glutamine level were measured in GS1-SPS1/SelD or l(2)01810-SPS1/SelD double knockdown cells. dsRNAs targeting GS1, SPS1/SelD, or l(2)01810 were prepared separately. For double knockdown, the mixtures of dsRNA targeting SPS1/SelD and either GS1 or l(2)01810 were prepared, and each mixture was added into the culture medium. The different dsRNAs used are shown on the x axis. Closed and open bars designate glutamine level and the frequency of cells, respectively. Experiments were performed in triplicate, and error bars denote the standard deviation from the mean of three independent experiments. Statistical significance was tested by pairwise Student's t test with Bonferroni correction for multiple testing. ** indicates significance at p < 0.0083 (α = 0.05, n = 6). A total of 500 cells was counted to determine the frequency of cells forming megamitochondria. B, megamitochondrial formation and glutamine level were also examined in the cells overexpressing GS1, l(2)01810, or both. Vectors for expressing GS1-HA or l(2)01810-HA were transfected separately or together into SL2 cells, and both the frequency of cells containing megamitochondria and the intracellular glutamine level were measured. Overexpressed proteins are shown on the x axis. Mock represents control cells transfected with the backbone vector. ** indicates significance at p < 0.0083 (α = 0.05, n = 6). C, correlation between megamitochondrial formation and the glutamine level. Linear regression analysis was performed using R software for 24 data sets obtained from knockdown and overexpression experiments. The equation for the relationship between the glutamine level (x) and frequency of megamitochondrial formation (y) was y = 1.235x − 11.329, where x is the glutamine level, and the correlation coefficient (r) was 0.94 (p value of slope = 2.91e−12).

