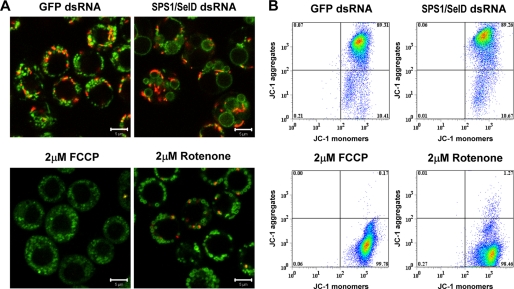
FIGURE 9.
Effect of SPS1/SelD knockdown on mitochondrial membrane potential. A, confocal image of JC-1-stained cells. Four days after dsRNA treatment, cells were stained with JC-1 and observed under the confocal microscope. 2 μm FCCP or rotenone was added to the cells for 6 h to inhibit mitochondrial function and used as positive controls for membrane depolarization. Green and red spots in each panel represent mitochondria whose membrane potential is low and high, respectively. Scale bars represent 5 μm. B, FACS analysis. Changes of MMP were measured quantitatively by FACS analysis as described under “Experimental Procedures.” x axis displays fluorescence 1 measurement (green fluorescence is indicative of JC-1 monomers or low MMP), and y axis displays fluorescence 2 measurement (red fluorescence is indicative of JC-1 aggregates or high MMP). Numbers are percent of the cell population in each quadrant. Data represent mean of three separate experiments.

