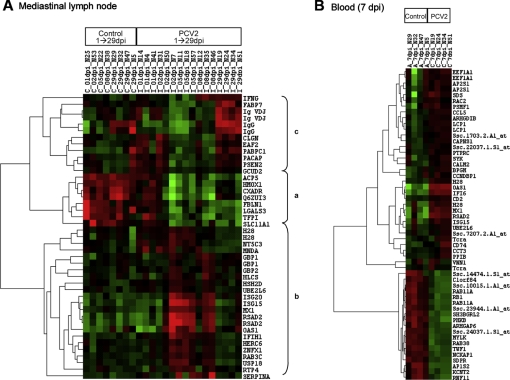
Figure 2.
Heat maps of the differentially expressed probes between control (C) and PCV2-inoculated (I) pigs in (A) mediastinal lymph node, where a, b, and c, represent clusters for globally down-regulated probes, and early and late up-regulated probes in the mediastinal lymph node dataset, respectively; and (B) blood samples. Red represents up-regulation and green shows down-regulation for differentially expressed genes (FDR < 0.1, fold change > 2.0). (A color version of this figure is available at: www.vetres.org.)

